Xymon custom graph config
Contents
collect the data with a script
hobbit server:/usr/lib/hobbit/client/ext/cputemp:
#!/bin/sh

#/usr/bin/sensors -f | grep "CPU Temp" | awk '{print $1 $2 $3}' |
#	awk {'sub("\+", ""); sub("°F", ""); print }' > /tmp/cputemp.txt
#/usr/bin/sensors -f | grep -i temp | grep -v k8temp| awk '{ sub("°F", ""); sub("\+", ""); sub("/", ""); sub(" +", ""); sub("\(.*$", ""); print}' > /tmp/cputemp.txt

RAWTEMP=`nvidia-smi -a | grep Temperature | sed -e "s/.*.://g" -e "s/C//g"`
FGPUTEMP=$((${RAWTEMP:-0}*9/5+32))
echo "temp1:$FGPUTEMP" > /tmp/cputemp.txt

/usr/bin/sensors -f | grep Temp | grep -v k8temp | awk '{sub(".F.*$",
""); sub(" +",""); sub("+",""); print}' >> /tmp/cputemp.txt

RESULT=`grep Core0Temp /tmp/cputemp.txt | awk '{ FS=":";  print int($2) }'`;
COLOR=green
if test "$RESULT" -gt 120
then
	COLOR=red
fi
if test "$RESULT" -lt 70
then
	COLOR=red
fi

$BB $BBDISP "status $MACHINE.cputemp $COLOR `date`

`cat /tmp/cputemp.txt`
"

exit 0
- you can run the script from the command line to test it
This is the expected output:
root@merkli:/usr/lib/hobbit/client/ext# ./cputemp
./cputemp: 24: status .cputemp green Thu Jul 21 10:23:23 PDT 2011

temp1:95.0
Core0Temp:
Core1Temp:
: not found
This particular script creates a temp file, so you can look at the timestamp on that to see if it is running:
root@merkli:/usr/lib/hobbit/client/ext# ls -l /tmp/cputemp.txt
-rw-r--r-- 1 hobbit hobbit 35 2011-07-21 10:26 /tmp/cputemp.txt
root@merkli:/usr/lib/hobbit/client/ext# cat /tmp/cputemp.txt
temp1:95.0
Core0Temp:
Core1Temp:
launch the script with hobbit
hobbit server:/usr/lib/hobbit/server/etc/hobbitlaunch.cfg:
[cputemp]
    ENVFILE /usr/lib/hobbit/client/etc/hobbitclient.cfg
    CMD /usr/lib/hobbit/client/ext/cputemp
    INTERVAL 5m
hobbit client:/usr/lib/hobbit/client/etc/hobbitlaunch.cfg
- wait for five minutes and then you should see the data in the web interface, but not the graph
collect the data in an RRD
From here on out, the configuration should all be on the server and not the client, since the RRD is stored on the server and the graphs are generated from that.
hobbit server:/usr/lib/hobbit/server/etc/hobbitserver.cfg
TEST2RRD="cpu=la,disk,inode,qtree,memory,$PINGCOLUMN=tcp,http=tcp,dns=tcp,dig=tcp,time=ntpstat,vmstat,iostat,netstat,temperature,apache,bind,sendmail,mailq,nmailq=mailq,socks,bea,iishealth,citrix,bbgen,bbtest,bbproxy,hobbitd,files,procs=processes,ports,clock,lines,ops,stats,cifs,JVM,JMS,HitCache,Session,JDBCConn,ExecQueue,JTA,TblSpace,RollBack,MemReq,InvObj,snapmirr,snaplist,snapshot,if_load=devmon,temp=devmon,paging,mdc,mdchitpct,cics,dsa,getvis,maxuser,nparts,cputemp=ncv,heater=ncv"
NCV_cputemp="temp1:GAUGE,Core0Temp:GAUGE,Core1Temp:GAUGE"
- restart hobbit after making these changes
- you can verify the RRD:
hobbit server:/var/lib/hobbit/rrd/localhost/cputemp.rrd
root@weasel:/var/lib/hobbit/rrd/localhost# rrdtool info ./cputemp.rrd
filename = "./cputemp.rrd"
rrd_version = "0003"
step = 300
last_update = 1311266629
header_size = 2320
ds[temp1].index = 0
ds[temp1].type = "GAUGE"
ds[temp1].minimal_heartbeat = 600
ds[temp1].min = NaN
ds[temp1].max = NaN
ds[temp1].last_ds = "131"
ds[temp1].value = 2.9999000000e+04
ds[temp1].unknown_sec = 0

root@weasel:/var/lib/hobbit/rrd/localhost# ls -lt cputemp.rrd
-rw-r--r-- 1 hobbit hobbit 57616 2011-07-21 09:43 cputemp.rrd
The timestamp on the file should be less than 5 minutes old and the data inside should correspond to the output of the script.
create a graph definition
hobbit server:/usr/lib/hobbit/server/etc/hobbitgraph.cfg:
[cputemp]
    TITLE CPU Temperature
    YAXIS Degrees Fahrenheit
    DEF:temp1=cputemp.rrd:temp1:AVERAGE
    DEF:Core0Temp=cputemp.rrd:Core0Temp:AVERAGE
    DEF:Core1Temp=cputemp.rrd:Core1Temp:AVERAGE
    LINE2:temp1#@COLOR@:temp1
    LINE2:Core0Temp#@COLOR@:Core0Temp
    LINE2:Core1Temp#@COLOR@:Core1Temp\n
troubleshooting
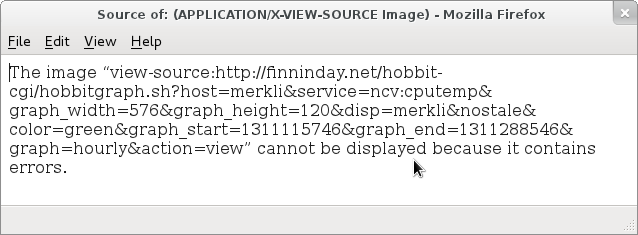
If a graph is not appearing, you can view source on the page with the missing graph and click on the IMG link that it is trying to display. But often that won't reveal anything useful.
It is difficult to manually run /usr/lib/hobbit/cgi-bin/hobbitgraph.sh with the parameters from the web page to see what the error is. hobbitgraph.sh is a shell wrapper around a binary called /usr/lib/hobbit/server/bin/hobbitgraph.cgi.
#!/bin/sh

# This is the Hobbit CGI script interface to hobbitgraph.cgi
#
# Install this script in your webservers' cgi-bin directory

. /usr/lib/hobbit/server/etc/hobbitcgi.cfg
 exec /usr/lib/hobbit/server/bin/hobbitgraph.cgi $CGI_HOBBITGRAPH_OPTS
Failing URL:
"/hobbit-cgi/hobbitgraph.sh?host=merkli&service=ncv:cputemp&graph_width=576&graph_height=120&disp=merkli&nostale&color=green&graph_start=1311105181&graph_end=1311277981&graph=hourly&action=view"
Looking at the environment variables as hobbitgraph.sh runs, I see this on a working query:
REQUEST_URI=/hobbit-cgi/hobbitgraph.sh?host=localhost&service=ncv:cputemp&graph_width=576&graph_height=120&disp=localhost&nostale&
color=green&graph_start=1311116740&graph_end=1311289540&graph=hourly&action=view
QUERY_STRING=host=localhost&service=ncv:cputemp&graph_width=576&graph_height=120&disp=localhost&nostale&color=green&
graph_start=1311116862&graph_end=1311289662&graph=hourly&action=view
And this for a failing query:
REQUEST_URI=/hobbit-cgi/hobbitgraph.sh?host=merkli&service=ncv:cputemp&graph_width=576&graph_height=120&disp=merkli&nostale&color=green&
graph_start=1311116888&graph_end=1311289688&graph=hourly&action=view
QUERY_STRING=host=merkli&service=ncv:cputemp&graph_width=576&graph_height=120&disp=merkli&nostale&color=green&graph_start=1311117131&
graph_end=1311289931&graph=hourly&action=view
manually generating a graph
In order to force a graphing error into view, you can manually attempt to generate the graph outside of hobbit, but using the same configuration and rrd that hobbit is using.
- locate the rrd
/var/lib/hobbit/rrd/merkli/cputemp.rrd
- locate the existing graph config
/usr/lib/hobbit/server/etc/hobbitgraph.cfg
[cputemp]
    TITLE CPU Temperature
    YAXIS Degrees Fahrenheit
    DEF:temp1=cputemp.rrd:temp1:AVERAGE
    DEF:Core0Temp=cputemp.rrd:Core0Temp:AVERAGE
    DEF:Core1Temp=cputemp.rrd:Core1Temp:AVERAGE
    LINE2:temp1#@COLOR@:temp1
    LINE2:Core0Temp#@COLOR@:Core0Temp
    LINE2:Core1Temp#@COLOR@:Core1Temp\n
- cook up a graph command
 $period = `date --date="7 days ago" +%s`;
 cp /var/lib/hobbit/rrd/merkli/cputemp.rrd /tmp/cputemp.rrd
 rrdtool graph /tmp/output.png --width 300 --start $period -v "Degrees Fahrenheit"  \
 DEF:temp1=/tmp/cputemp.rrd:temp1:AVERAGE \
 DEF:Core0Temp=/tmp/temp.rrd:Core0Temp:AVERAGE \
 DEF:Core1Temp=/tmp/temp.rrd:Core1Temp:AVERAGE \
 LINE2:temp1#FF0000:temp1 \
 LINE2:Core0Temp#00FF00:Core0Temp \
 LINE2:Core1Temp#0000FF:Core1Temp
